- Prerequisites and Installation
- 1. RivaTuner Statistics Server (RTSS)
- 2. MSI Afterburner
- 3. CapFrameX (for extended overlay options)
- 4. HWiNFO64 (for displaying advanced hardware sensor data)
- Setting up Overlays via MSI Afterburner
- Setting up your own overlay via MSI Afterburner
- Using pre-made RTSS overlay templates
- Using TroyMetrics Benchmark Overlays
- Setting up Custom Overlays in CapFrameX
- How the CapFrameX overlay works
- Customizing overlay items
- Overlay items
- Overlay items list
- Colors, limits, and format Options
- Group names and separators
- Multiple overlay profiles
- Overlay control section
- Using multiple overlay profiles
- Importing and exporting overlay templates
- Advanced options and positioning
- CapFrameX overlay setup example
- Overlay Best Practices
- Keep it clean and readable
- Use different profiles for various scenarios
- Minimize conflicts with other overlays.
- Watch for potential performance Impacts
- Troubleshooting Common Overlay Issues
- Overlay doesn't appear in-game
- Performance metrics/sensors are missing or display invalid values
- Overlay flickers, lags, is rendered improperly, or even causes game crashes
- Clean reinstall of the overlay tools as a last resort
- Final Words
Whether you’re benchmarking, optimizing your game settings, or just trying to get the smoothest gaming experience possible, visual performance feedback in-game can make all the difference. On-screen display (OSD) overlays show real-time performance data such as framerate, frametime, hardware utilization, temperatures, and more, giving you immediate insight into how your system behaves under load. At the heart of most high-quality overlays is RivaTuner Statistics Server (RTSS), a lightweight engine that hooks into games and renders customizable performance metrics on top of your game. RTSS is widely used in the PC gaming community because it’s flexible, low-overhead, and compatible with multiple tools that feed it telemetry data.
In this guide, we’ll walk you through two ways to set up RTSS-based overlays:
- MSI Afterburner’s built-in RTSS overlay: an easy place to start for hardware performance and sensor monitoring.
- CapFrameX’s custom overlay system: great for benchmarkers who want to monitor an even larger array of performance metrics and sensors.
By the end of this article, you’ll hopefully understand how to set up each overlay method, tailor the data shown to your needs, and troubleshoot common issues, so you can monitor performance with clarity and precision in any game.
Prerequisites and Installation
Before you can create high-quality in-game overlays with RTSS, you’ll need to make sure a few core pieces of software are installed and configured properly. RTSS is the engine that actually draws overlays in games, while the other tools act as frontends that enhance its output.
1. RivaTuner Statistics Server (RTSS)
At the heart of any on-screen overlay setup is RivaTuner Statistics Server, a lightweight utility that hooks into DirectX/OpenGL/Vulkan games and renders custom performance metrics/hardware sensor data on top of them. RTSS was created by Alexey Nicolaychuk, a Russian programmer also known by the handle “Unwinder. RTSS originally began as a companion component to his RivaTuner overclocking and hardware-monitoring utility, providing real-time performance monitoring and on-screen display (OSD) capabilities. Over time, RTSS evolved into a standalone statistics server focused on low-overhead hardware monitoring, OSD rendering, and performance overlay support. It is widely used on its own or bundled with tools like MSI Afterburner for displaying real-time performance data in games and benchmarks.
You can download the latest version of RTSS from the following link:
https://www.guru3d.com/download/rtss-rivatuner-statistics-server-download/
Following RTSS’s installation, open the program (by clicking its icon that should be found in the Windows System Tray), then make sure that the Show On-Screen Display toggle is set to ON, as this will allow the aforementioned OSD overlay programs to show you the overlay on top of your games.
Note: We strongly recommend installing MSI Afterburner alongside RTSS rather than RTSS by itself, as you’ll not only get a tool to set up your overlay, but also many more useful features to tune your GPU.
2. MSI Afterburner
MSI Afterburner, which is also made by Unwinder, is the go-to tool for many PC gamers and enthusiasts because it:
- Integrates directly with RTSS for real-time overlay stats.
- Let you choose which hardware metrics (CPU/GPU usage, temps, clocks, voltages, etc.) are tracked and sent to the RTSS overlay.
- Is widely supported on NVIDIA, AMD, and Intel GPUs.
- Includes extra, useful features such as GPU fan control, voltage adjustment, and tuning features beyond overlay setup.
You can download the latest version of Afterburner from the following link:
https://www.guru3d.com/download/msi-afterburner-beta-download/
When installing Afterburner, make sure that RTSS is checked during installation so that both programs get installed together, but only if you haven’t already installed RTSS previously yourself.
Note: Afterburner and RTSS are tightly interlinked, as Afterburner simply tells RTSS what to show in the overlay. If RTSS isn’t installed or running, Afterburner won’t show an overlay.
3. CapFrameX (for extended overlay options)
If you want an overlay that’s tailored for benchmarking data (frametime graphs, percentile FPS metrics, latency info, etc.), then CapFrameX is an excellent choice. In fact:
- CapFrameX uses RTSS under the hood to display its OSD elements, so having RTSS installed (from Afterburner or standalone) is still required to display an overlay with it.
- In CapFrameX’s Overlay tab, you can customize what CapFrameX sends to RTSS and organize layouts for benchmark runs.
- Unlike Afterburner’s default OSD, CapFrameX’s overlay is meant to be paired with captured datasets and live statistics, which is great for deeper analysis of performance data.
You can download the latest CapFrameX release from this page:
https://github.com/CXWorld/CapFrameX/releases
4. HWiNFO64 (for displaying advanced hardware sensor data)
For the most complete overlay experience, you’ll want to install HWiNFO64, as:
- It provides deep sensor telemetry (such as certain hardware voltages, temps, or throttle flags) that RTSS or Afterburner alone do not expose.
- TroyMetrics Benchmark-Overlays will specifically require HWiNFO64’s Shared Memory Support to ingest real-time sensor data for modules like thermal throttling or render latency.
You can download the latest version of HWiNFO64 from the link below:
https://www.hwinfo.com/download
Note: After launching HWiNFO64, start it in Sensors-only mode, then click the Configure Sensors button in the bottom right of the program’s UI (gray gear icon), then click the Main Settings button in the ensuing window, and finally enable the Shared Memory Support option so that RTSS and other overlay tools can read HWiNFO64’s sensor outputs. Unfortunately, you’ll have to redo this every 12 hours in the free version of the program.
![How to Set Up High Quality Performance Overlays with RTSS The image shows HWiNFO 64's settings windows with options like 'Main Settings' and 'Shared Memory Support [12-HOUR LIMIT]' highlighted in red, along with various configuration settings for monitoring and resetting preferences.](https://techreport.gr/wp-content/uploads/2026/01/image-130.png)
Setting up Overlays via MSI Afterburner
Performance overlays are incredibly useful when you’re tuning settings, benchmarking, or just curious about how your system behaves in real time. With MSI Afterburner + RTSS, you can either build your own overlay from scratch (using Afterburner’s Monitoring tab) or load pre-made templates that take all the work out of designing an overlay yourself.
RTSS is the engine that renders the overlay in-game, and Afterburner tells it what data to display, such as CPU/GPU usage, temperatures, framerate, frametimes, etc. As such, having both programs installed and running is essential to setting up functional OSD overlays.
Setting up your own overlay via MSI Afterburner
Before loading any fancy templates, you can build a custom overlay yourself directly in MSI Afterburner by following the steps below:
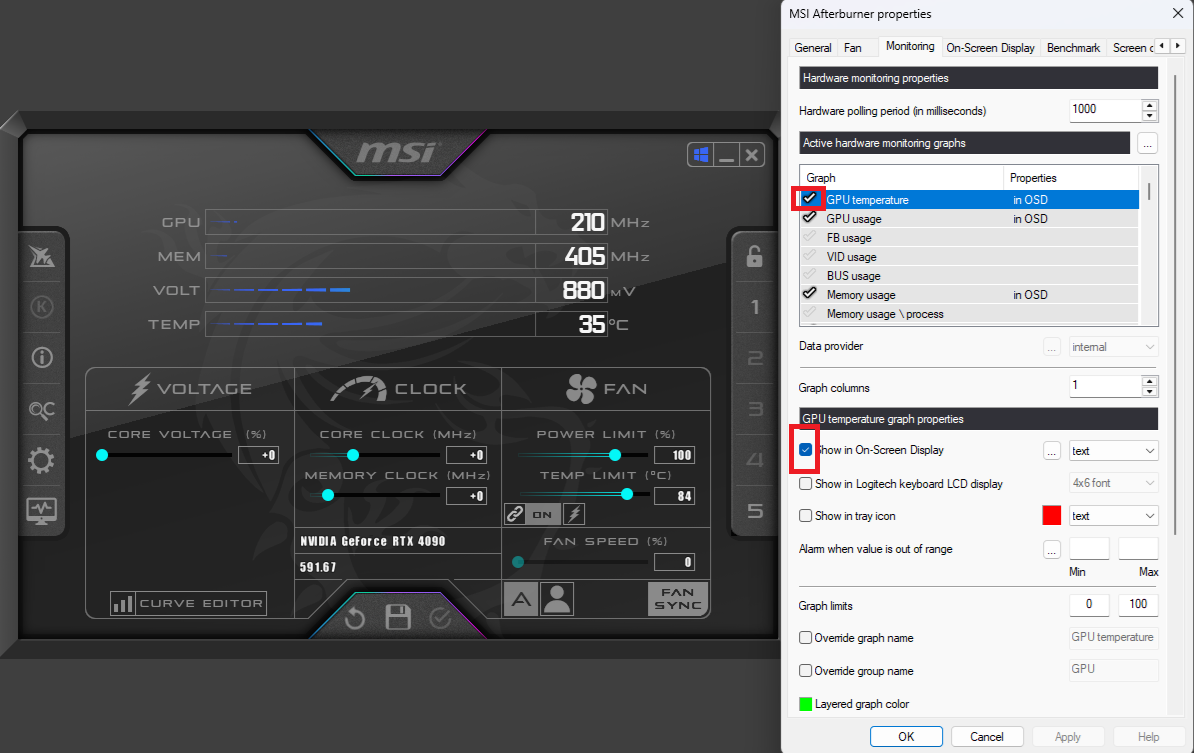
- Open MSI Afterburner, then access the Monitoring tab either by clicking on the Settings button (its location can vary depending upon your chosen Afterburner skin) or by hitting the Ctrl+S hotkey shortcut. This tab lists all the hardware sensors Afterburner can track (for example, GPU usage, CPU temperature, framerate, etc.).
- Enable sensors for the OSD overlay:
- For each performance metric or hardware sensor you want in your overlay, tick the box next to it and then check “Show in On-Screen Display. You can also choose whether to display your chosen metric in a text format, a graph format, or both.
- Common picks include Framerate, Frametime, GPU Usage/Temperature, CPU Usage/Temperature, VRAM Usage, and RAM Usage.
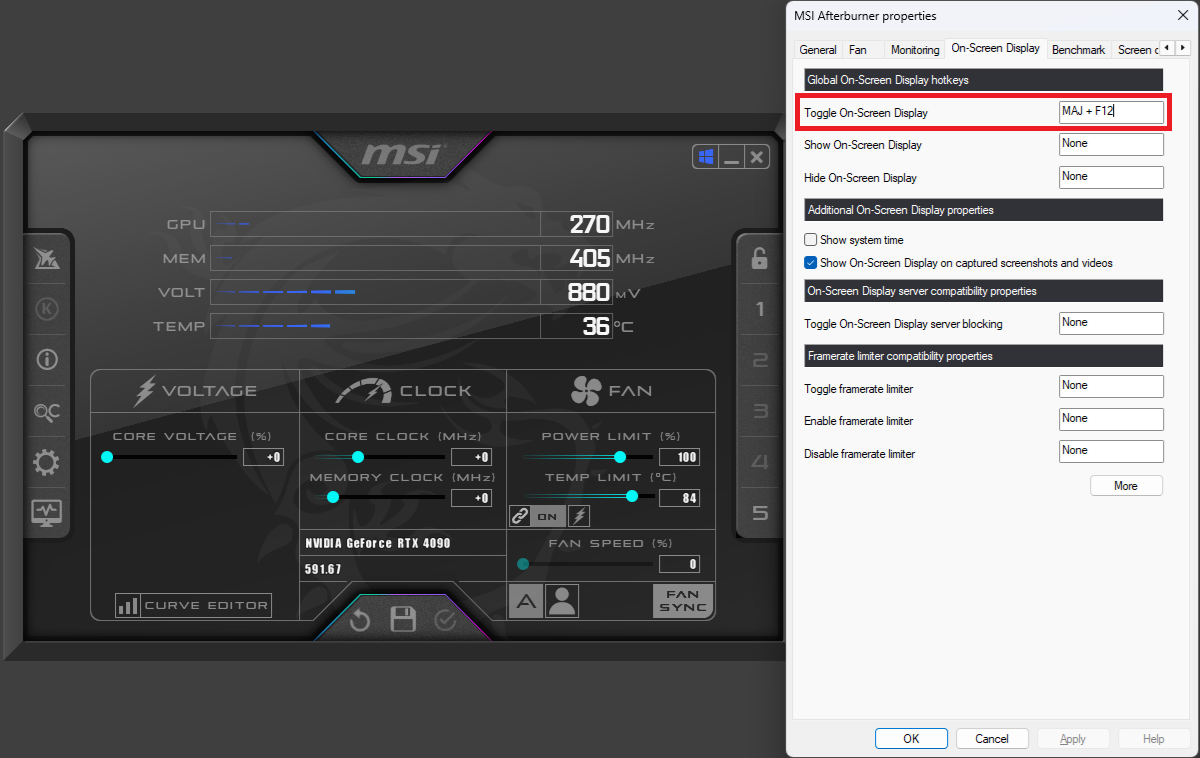
- Set a hotkey for toggling the overlay by opening the On-Screen Display tab in Afterburner, then assigning a hotkey for “Toggle On-Screen Display. This lets you toggle the overlay in-game.
- Confirm that RTSS is running by checking that it’s present in the Windows System Tray before launching your game.
This built-in method is quick, flexible, and perfect for adding just the stats you want without any additional templates.
Using pre-made RTSS overlay templates
While you can customize your own overlay via Afterburner, using pre-configured templates can make the process much easier and give you a more polished overlay display out of the box. Thankfully, RTSS already comes bundled with some nice overlay templates, which we can use to display beautiful OSD overlays. The following steps will detail how you can do this yourself:
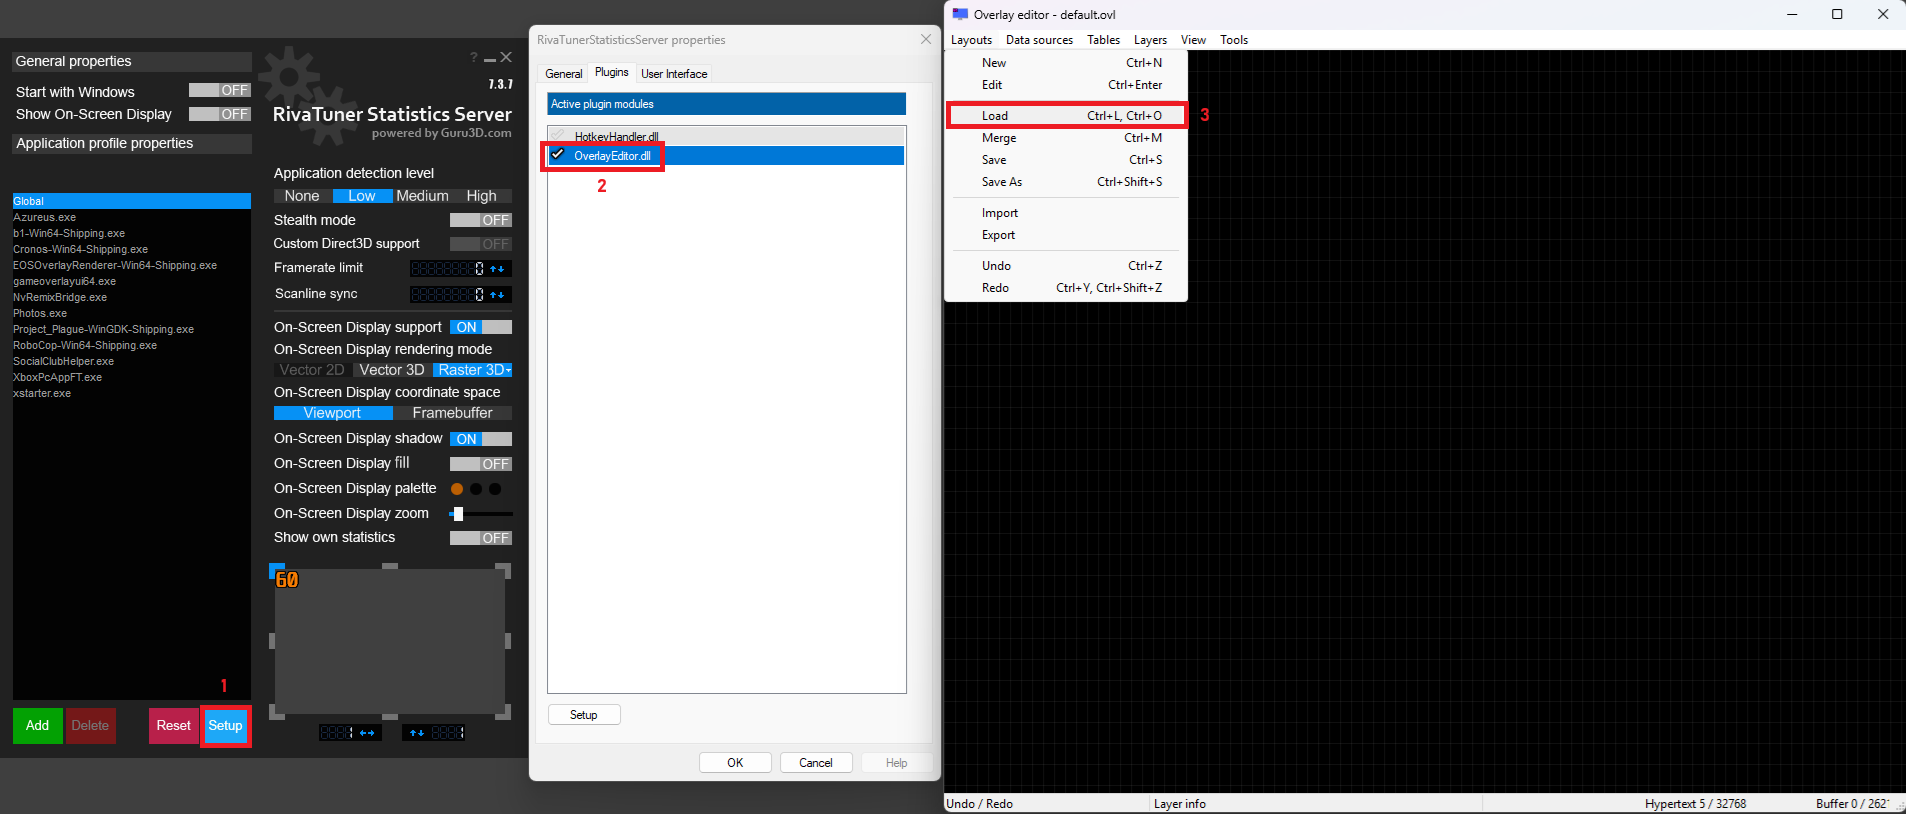
- Enable the Overlay Editor in RTSS:
- Open RTSS, then click on Setup, go to the Plugins tab, and check OverlayEditor.dll, then double-click it to launch the editor.
- Load an overlay layout:
- Open the Overlay Editor by double-clicking OverlayEditor.dll, then in it switch to Layouts, then Load, then finally choose one of the
.ovlfiles that are located inYOUR RTSS INSTALLATION DIRECTORY\Plugins\Client\Overlays. - These templates are ready to go, and they display key stats without you needing to manually add each sensor.
- Open the Overlay Editor by double-clicking OverlayEditor.dll, then in it switch to Layouts, then Load, then finally choose one of the
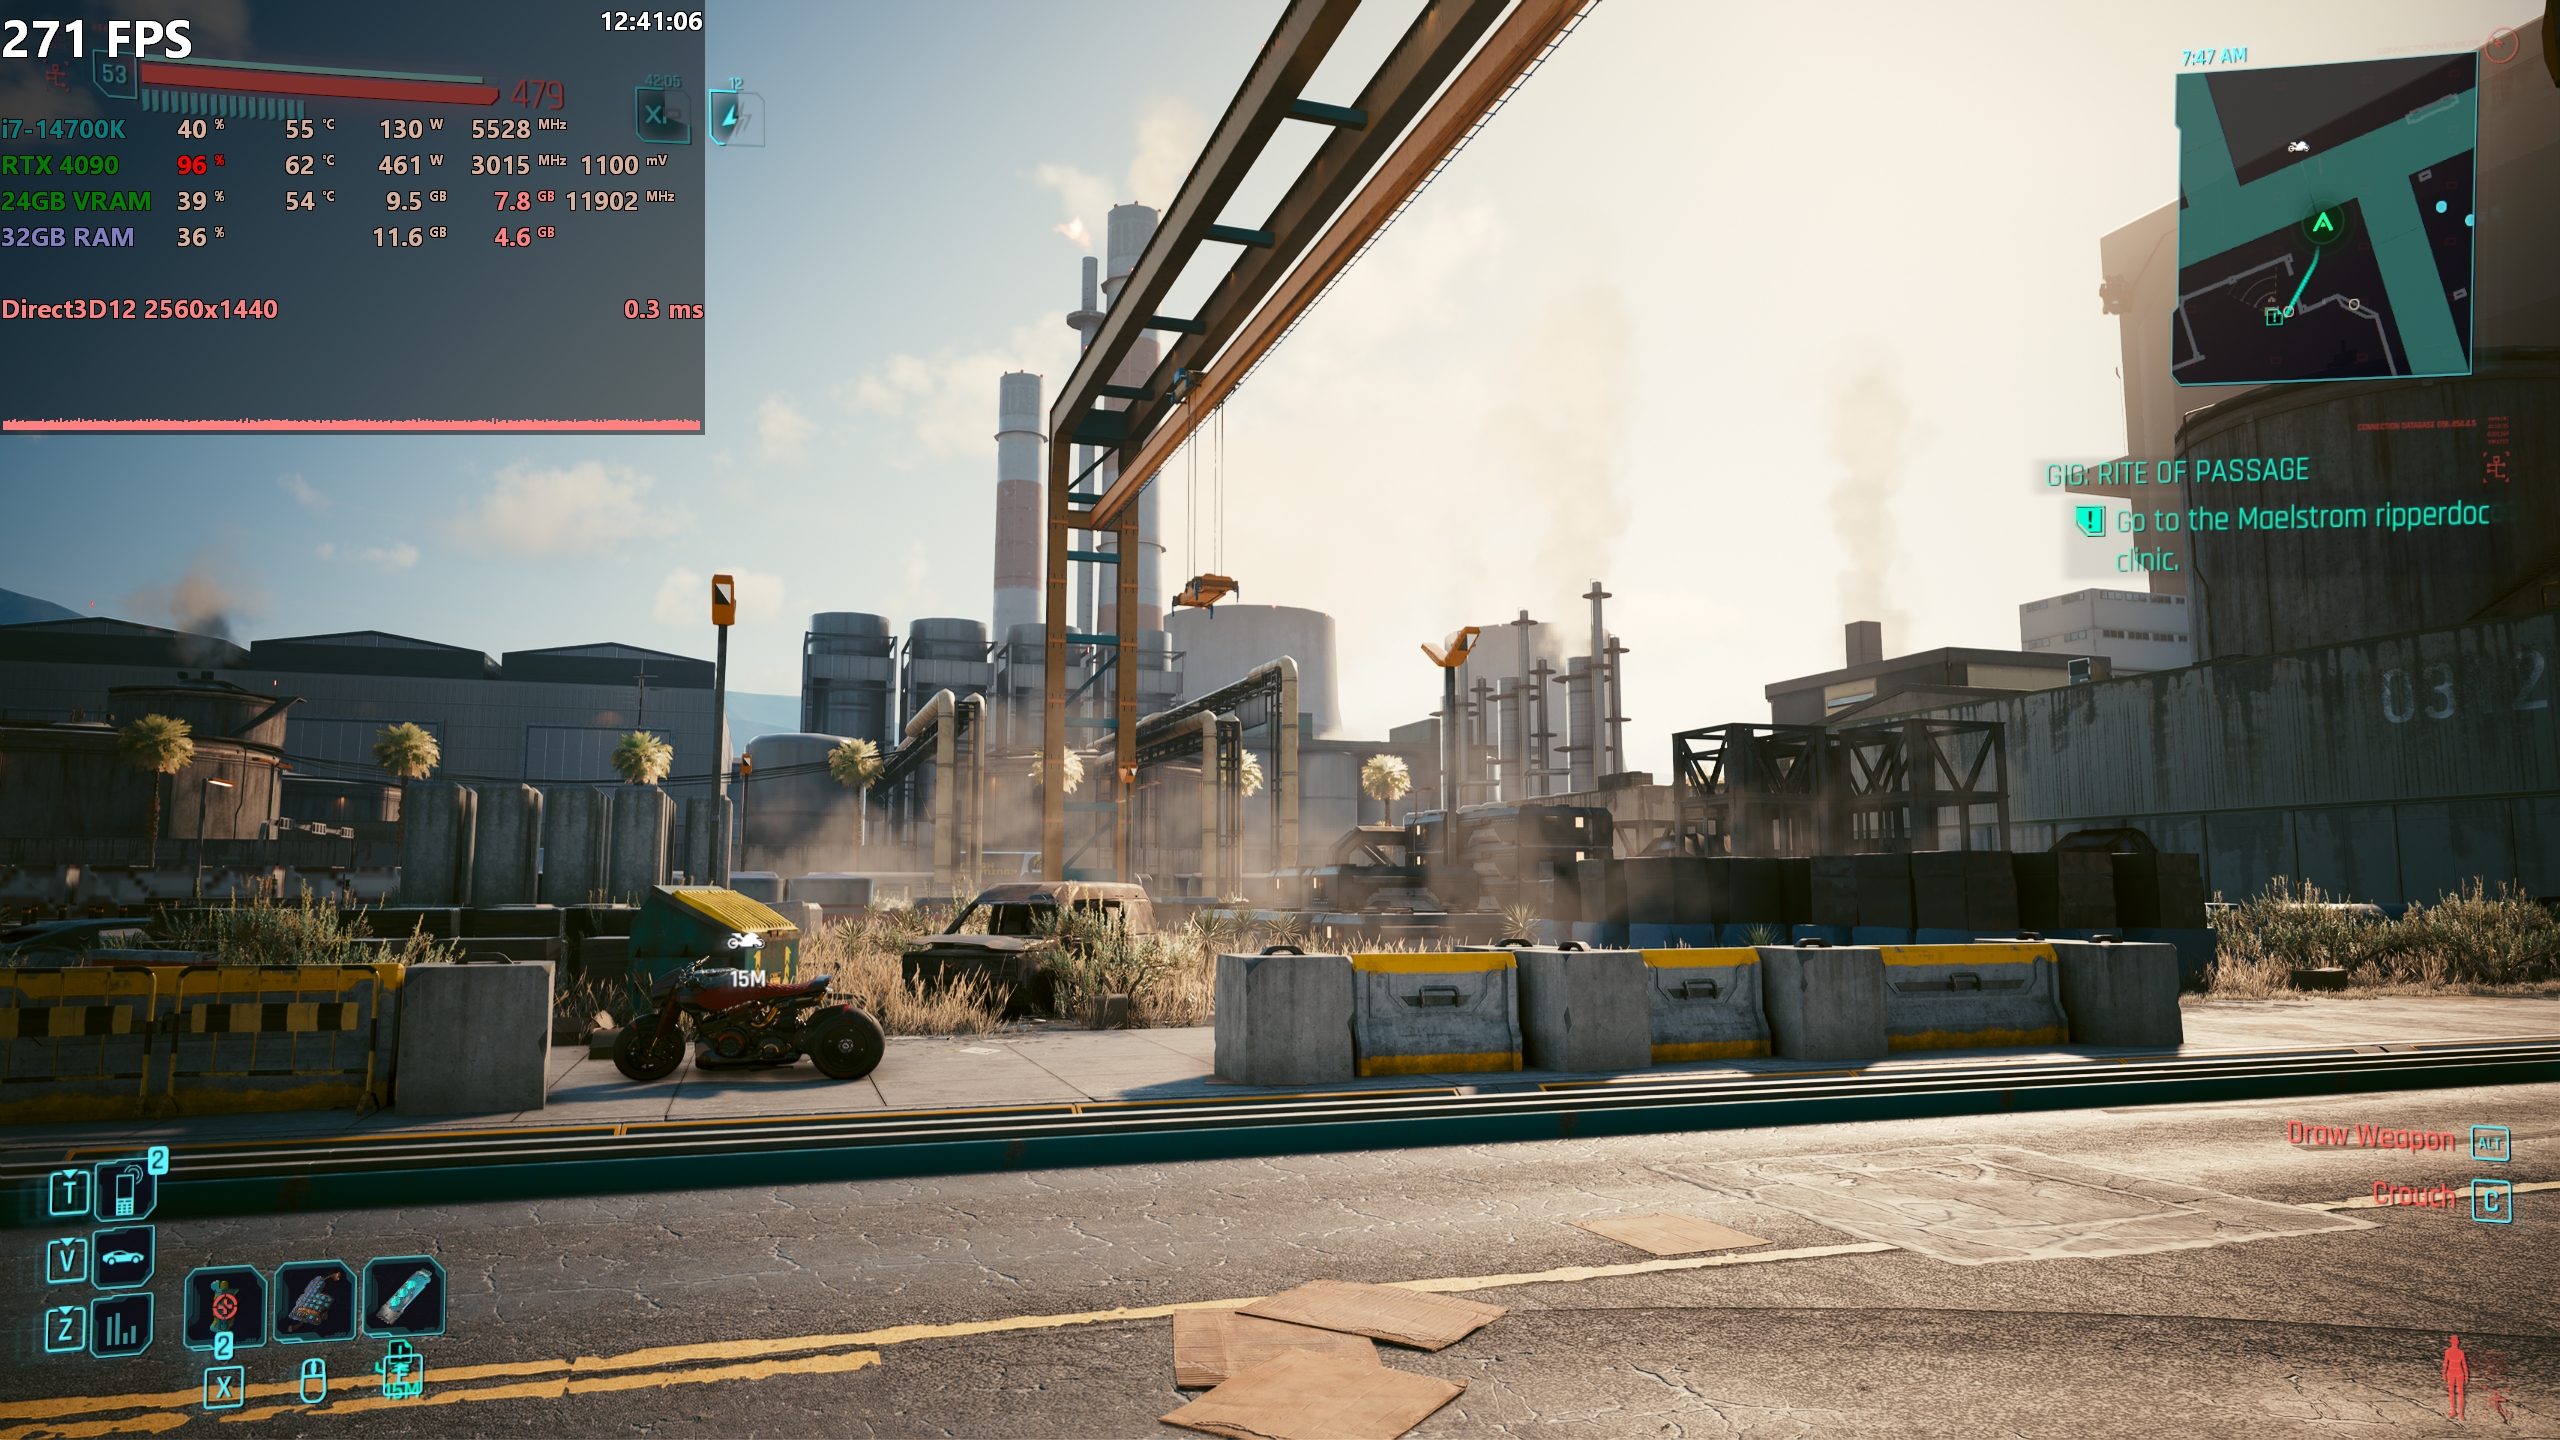
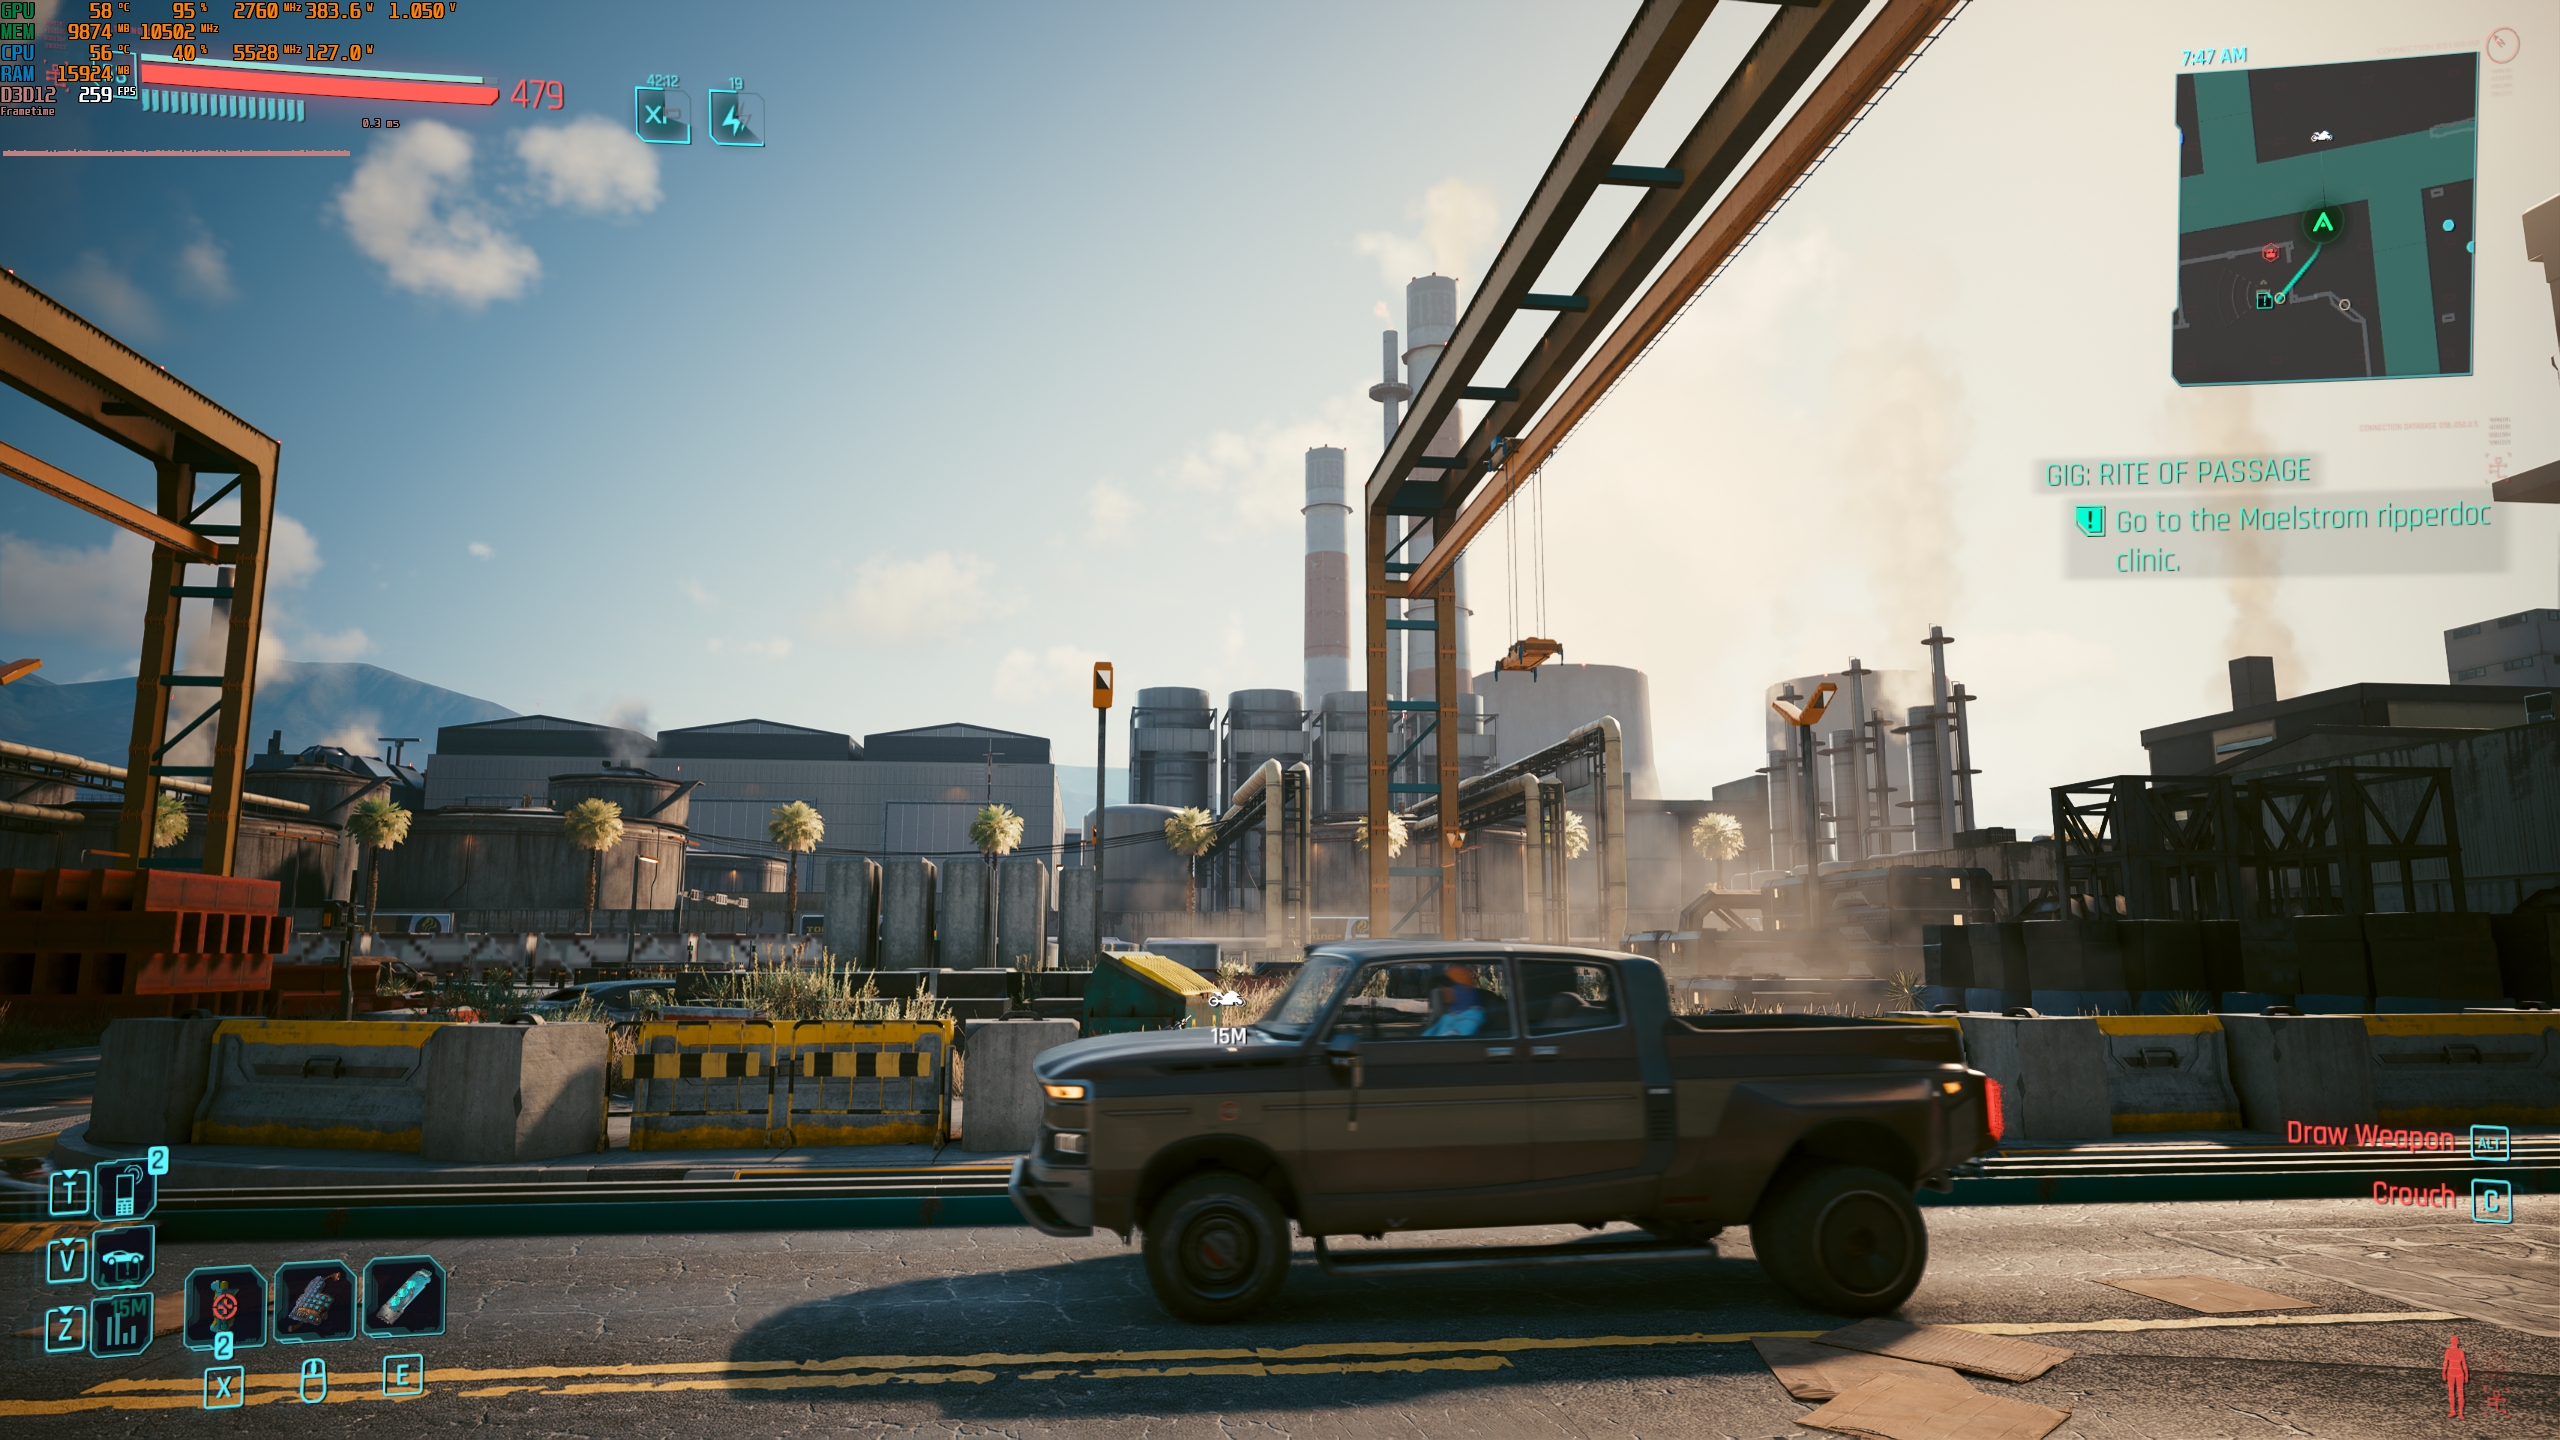
classic.ovl overlay templateIf you want your Afterburner/RTSS overlay to look like the one on the screenshot above, then you can grab this customized overlay template from the link below, and import it via the RTSS Overlay Editor, by using the aforementioned method:
https://www.mediafire.com/file/j88cqnpcgl0g2fu/Custom+Afterburner-RTSS+Overlay.ovl/file
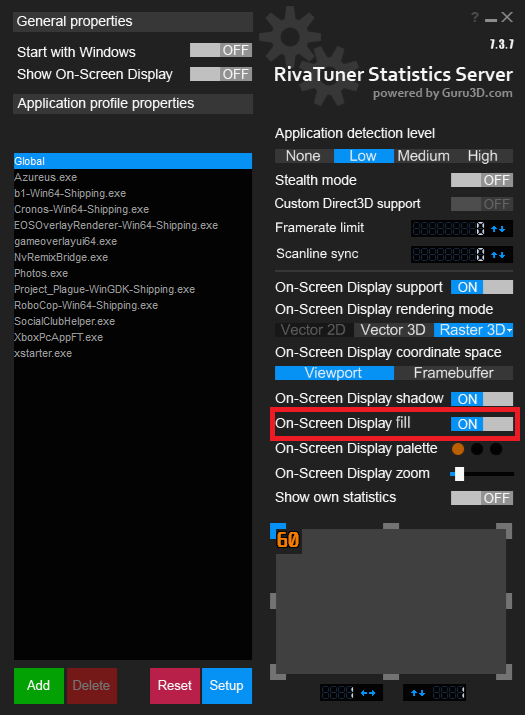
Note: If you also want the transparent black background to appear underneath the overlay metric/sensor data, then enable the On-Screen Display fill option in RTSS settings:
Using TroyMetrics Benchmark Overlays
If you want a professional, benchmark-focused overlay with rich telemetry and advanced visualization features, the TroyMetrics Benchmark Overlays package is a great step up. These overlays are designed for benchmarkers, content creators, and enthusiasts, and they include metrics beyond basic performance metrics and hardware sensor data, like latency modules, adaptive CPU bar charts, enhanced frametime graphs, power delivery widgets, and more.
Highlights of TroyMetrics Overlays:
- Fully adaptive CPU utilization display that automatically adjusts for 4–24 cores.
- Latency module that shows NVIDIA Reflex Low Latency/PresentMon render/PC Latency in real time.
- Frametime graph and stutter detection, giving visual cues for smoothness.
- Thermal throttle detection using sensors from HWiNFO64.
- Power Detector module (for supported GPUs with per-pin telemetry).
- Includes many presets with color variants and display optimizations.
You can follow the extremely detailed overlay setup guide in the “Setup & Installation” section that is found on the official GitHub page of this overlay pack, which can be accessed from the following link:
https://github.com/TroyMetrics/Benchmark-Overlays
These overlays are engineered to provide rich, high-information real-time displays tailored for performance analysis and benchmarking, which is far beyond what basic overlays provide. Further, they’re also updated frequently and include options for color customization and dynamic modules.
Setting up Custom Overlays in CapFrameX
CapFrameX doesn’t just capture and analyze frametime data; it also lets you build custom performance overlays that display real-time performance metrics and hardware sensor data in-game using RTSS as its overlay rendering backend. This gives you flexible, benchmark-centric overlays that can show exactly the stats you care about while making performance captures or just eyeing a game’s performance profile.
How the CapFrameX overlay works
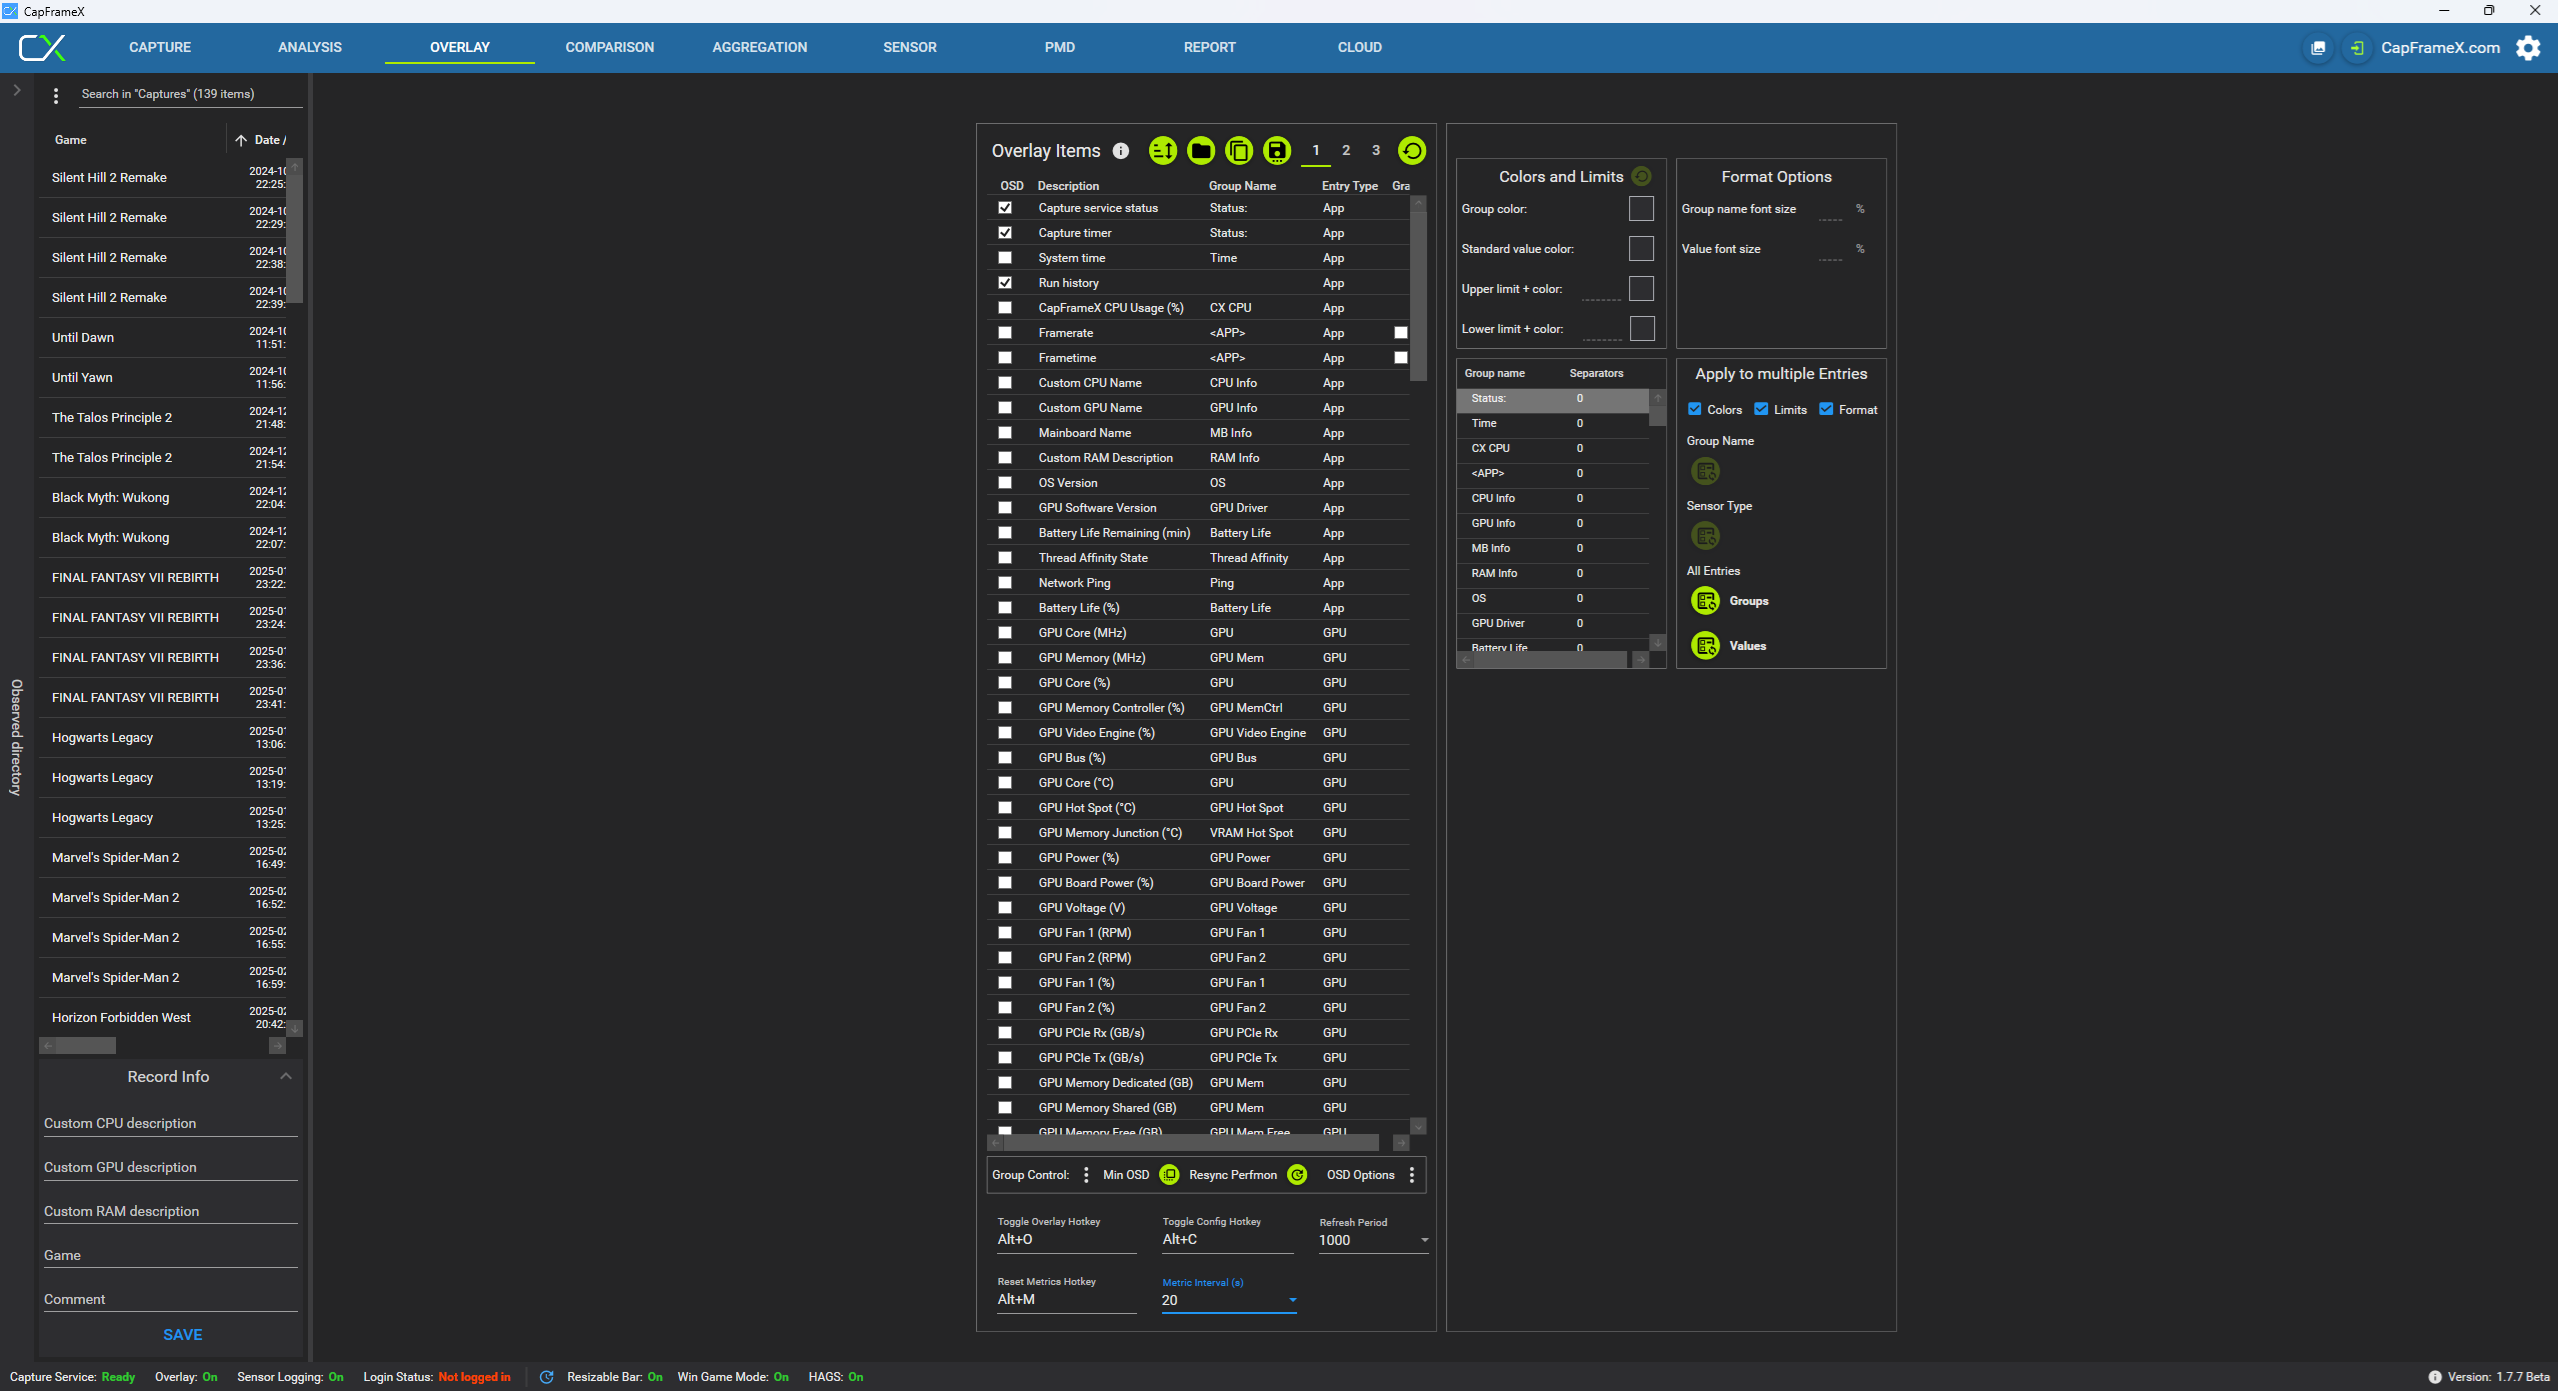
CapFrameX’s Overlay tab lets you choose which items to display, how they’re grouped, and how they look. Like Afterburner, it uses RTSS to actually render the overlay on top of the game.
In the Overlay tab, you’ll find:
- An extensive list of overlay items (for example, hardware info, framerate, frametimes, hardware sensor values, etc.) that can be reordered and grouped as you wish.
- Three separate overlay profiles that you can customize independently, so you can switch between different presets easily.
- Controls for colors, format, group names, and separators to improve the readability and organization of your overlay.
- Settings to configure the overlay toggling and profile switching hotkeys, the refresh period, metric interval, and reset metrics data.
Customizing overlay items
CapFrameX gives you granular control over how each metric looks and behaves. The following will be a brief explainer of what each section in the Overlay tab does:
Overlay items
This area lets you configure what performance data CapFrameX shows on-screen via RTSS, and how it looks. You’re essentially building a custom real-time overlay tailored to your benchmarking or testing needs.
Overlay items list
- Shows a list of all metrics currently set to be shown in the OSD (performance metrics and hardware sensors). These metrics are split into four columns: OSD toggle, description, group name, entry type, and whether to plot suitable entries into a graph.
- You can add or remove entries by ticking/unticking their corresponding OSD checkboxes and drag-and-drop them to change the overlay order.
- Items with the same group name display on the same line in the overlay, which helps organize CPU vs GPU vs RAM metrics.
- Each entry has a group name you can edit. Entries with identical group names get treated as part of the same line.
- Rearranging entries changes how the overlay is laid out visually.
- You can also control which groups show in the overlay, set a minimalistic overlay with only the framerate and frametime being shown, reset the Windows Performance Monitor, and tweak extra overlay options related to CapFrameX benchmark captures.
Colors, limits, and format Options
- Configure text colors, threshold colors, and conditional formatting (for example, turn the GPU temperature sensor value red above a certain limit).
- Text size and formatting options help make the overlay more readable at a glance.
Group names and separators
- You can set visual separators between different groups to space out related metric blocks in the overlay for clarity.
- Ideal when you show many metrics but want visual separation between categories (CPU, GPU, VRAM, RAM, etc.).
Multiple overlay profiles
- CapFrameX supports 3 separate overlay configuration slots (OverlayEntryConfiguration_0, _1, _2).
- You can switch between profiles for different scenarios (benchmarking, regular gameplay, streaming).
- These profiles are saved in
%APPDATA%\CapFrameX\Configurationas.jsonfiles.
Overlay control section
This section has many options to control the hotkeys with which you can switch the overlay on or off in-game, not to mention switching between the three different overlay profiles. You can also control the overlay refresh period and metric interval (AKA the real-time metrics calculation timeframe in seconds), and reset the overlay metrics as well.
Using multiple overlay profiles
CapFrameX supports three separate configuration profiles (usually named OverlayEntryConfiguration_0, OverlayEntryConfiguration_1, and OverlayEntryConfiguration_2) that allow you to save different layouts. For example:
- A benchmarking profile with lots of real-time performance metrics and hardware sensor data.
- A gaming profile with minimal info to reduce distraction and reduce overlay clutter.
- A streaming profile that's optimized for viewers with minimal overlay clutter.
These .json configuration files are stored in the CapFrameX configuration folder (located in %APPDATA%\CapFrameX\Configuration).
Importing and exporting overlay templates
CapFrameX supports importing overlay templates created by others:
- Save or download a
.jsonoverlay configuration file (for example, one that's tweaked for your CPU/GPU combo). - Place it into the CapFrameX configuration folder.
- Restart CapFrameX and switch to the corresponding overlay profile index (for example, Profile 1).
- Adjust group names and colors to match your hardware if needed. For example, rename a group from “RTX 3070” to “RTX 4090” so that the colors and labels match.
This makes it easy to import shared setups or start from a template and tweak it for your system.
Advanced options and positioning
Newer versions of CapFrameX also let you:
- Set a custom overlay position on screen independent from the default RTSS location, useful when using RTSS’s OverlayEditor or avoiding in-game HUD elements.
- Configure an overlay hotkey separate from the global RTSS hotkey so you can hide CapFrameX entries but keep other overlays visible.
By mastering the Overlay tab in CapFrameX, you can create custom, data-rich overlays that are tailored to your benchmarking style, showing the exact performance data you want in a layout you control, all rendered on top of your game in real time.
CapFrameX overlay setup example
In order to set up a CapFrameX benchmarking overlay for your system, it is possible to start from scratch and customize your overlay as you see fit. However, we strongly recommend downloading a pre-made overlay template and customizing it to fit your needs, as that will help you save valuable time during overlay setup.
You can download CapFrameX overlay templates from this link:
https://cxblobs.blob.core.windows.net/downloads/Overlay_Config_Templates.zip
Using an Intel+NVIDIA CapFrameX overlay template from the link above as a starting point, I was able to further customize it to my liking and come up with the following overlay setup:

Overlay Best Practices
Configuring performance overlays with RTSS, whether through MSI Afterburner or CapFrameX, is an effective way to monitor your system's gaming performance and health in real time. With that said, there are some thoughtful practices you can follow that will help ensure your overlay actually provides added value to you. Here are some key tips to get the most out of your on-screen performance data:
Keep it clean and readable
Overlays that are too large or too busy can obscure gameplay and actually make performance harder to interpret. As such, we recommend prioritizing only the performance metrics that you truly care about and hiding secondary data unless you need it for some other purpose. Further, it's highly recommended to adjust the font size, opacity, and position of your overlay so that it stays visible without blocking important in-game content.
Use different profiles for various scenarios
All the aforementioned overlay tools will let you create, save, and load multiple overlay configurations, which is why we recommend having multiple overlay profiles, with each one tailored for a specific use case. For example:
- A benchmarking profile with lots of display data (frametimes, hardware utilization, temps, etc.).
- A gaming profile with just framerate and hardware temps being displayed.
- A streaming or recording profile that minimizes overlay clutter for viewers.
Minimize conflicts with other overlays.
Overlays from apps such as Discord, Steam, Xbox Game Bar, or any other tools can potentially interfere with RTSS and cause various unpredictable issues. Therefore, we highly recommend turning off other overlays if you opt to use an RTSS-based overlay.
Watch for potential performance Impacts
While RTSS and its front-end tools are relatively lightweight, displaying too many metrics at once, especially at high refresh frequencies, can add a performance overhead. The power percentage sensor on NVIDIA GPUs deserves special attention, as it's known to potentially cause stuttering in games, especially with a high refresh frequency. Thus, should you notice any performance issues that were added after setting up your overlay, dial back sensor refresh rates or reduce the number of displayed performance metrics/sensors.
Troubleshooting Common Overlay Issues
Even after you’ve set up your RTSS-based overlay, it’s common to encounter quirks or conflicts, especially since overlays rely on injecting data into a game’s graphics rendering pipeline and thus can easily clash with other software or specific game engines. The following are some of the most frequent problems and how to address them.
Overlay doesn't appear in-game
If the overlay never shows up at all, this usually means that either RTSS isn’t running or it’s not hooking into the game correctly. Should this happen for you, check the following elements:
- Make sure RTSS is running (look for the RTSS icon in the system tray). If it’s not there, launch it manually.
- Check Detection Level: In RTSS, adjust the Application Detection Level, as sometimes Medium/High works better than Low, depending on the game.
- Some games (especially those using anti-cheat systems) can block overlays entirely. Switching from full-screen mode to borderless (or vice versa) or changing the graphics API (if applicable) can help, but is not a guaranteed solution.
Performance metrics/sensors are missing or display invalid values
If your overlay appears but shows invalid or missing performance metric/sensor data, then you might try the following workarounds:
- In CapFrameX, this often means no specific process was selected for capture, so it doesn’t know which process to pull metrics from. Make sure the correct game process is detected.
- In Afterburner/RTSS, check that you’ve enabled the desired metrics in the Monitoring tab and ticked the Show On-Screen Display checkbox.
- Other overlays (Steam, Discord, GPU vendor overlays, Xbox Game Bar, etc.) can potentially interfere with RTSS overlay rendering. Disable them temporarily to test.
Overlay flickers, lags, is rendered improperly, or even causes game crashes
Flickering overlays or inconsistent rendering can be caused by:
- Framerate or overlay refresh rate mismatches. Lowering RTSS’s OSD refresh rate can potentially help fix or alleviate this issue.
- Outdated GPU drivers. Always update to the latest system (and especially graphics) drivers, and if the problem persists, perform a clean reinstall using a tool like DDU.
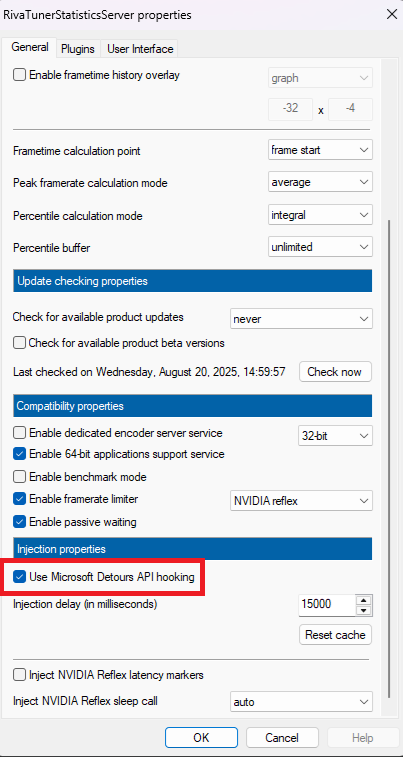
- Enable Microsoft Detours API hooking in RTSS settings, as that can help with stability in some games, and especially if you're using driver-level frame generation techniques like NVIDIA Smooth Motion or AMD Advanced Fluid Motion Frames.
Clean reinstall of the overlay tools as a last resort
If nothing seems to fix your issues:
- Fully uninstall RTSS and MSI Afterburner, delete leftover installation folders, reboot, and perform a clean install. This clears potentially corrupted configuration files that can cause overlay problems.
- Avoid reinstalling corrupted or mismatched versions.
- Always use builds from trusted websites.
Final Words
Performance overlays aren’t just for enthusiasts. They’re a powerful tool for anyone who wants a deeper understanding of what’s happening inside their PC while gaming or benchmarking. At the heart of most high-quality overlays is RTSS. With it, you can see how your system responds in real time, track bottlenecks, identify anomalies, or simply confirm that a new setting is actually improving performance.
Each one of the two overlay setup methods we've discussed in this guide has its place, from quick, easy monitoring to detailed benchmarking overlays that would satisfy reviewers and content creators alike. As you experiment, you’ll find it’s worth balancing the amount of on-screen information with visual clarity, especially for competitive play or content capture. And while RTSS itself has a learning curve and occasional compatibility quirks with certain games or other overlay software, mastering its setup unlocks a new dimension of visibility into your PC’s performance.
Whether you’re trying to squeeze out extra frames, troubleshoot performance issues, or simply understand why your GPU isn’t hitting its full potential, properly configured RTSS overlays can save you time and give you insight most gamers never see. Now that you know how to set up overlays with Afterburner and CapFrameX, you’re ready to thoroughly monitor your system's performance, and thus make better decisions about graphics settings tweaking and even potential hardware upgrades.
Follow Wccftech on Google to get more of our news coverage in your feeds.
VIA: wccftech.com

